Abandoned Trademark Applications Analysis
USPTO Trademark Application Trends, A Decade in Review
Rate Of Abandonment By Class
Highest Rate Of Abandonment

034 Smokers' Products
Lowest Rate Of Abandonment

011 Environmental Control Instrument

The trademark application abandonment rate is consistent with product evolution speed and volatility.
The classes with the highest rates of abandonment seem to be found in consumer-driven markets where products evolve quickly; whereas the classes with the lowest rates of abandonment seem to reflect less volatile markets.
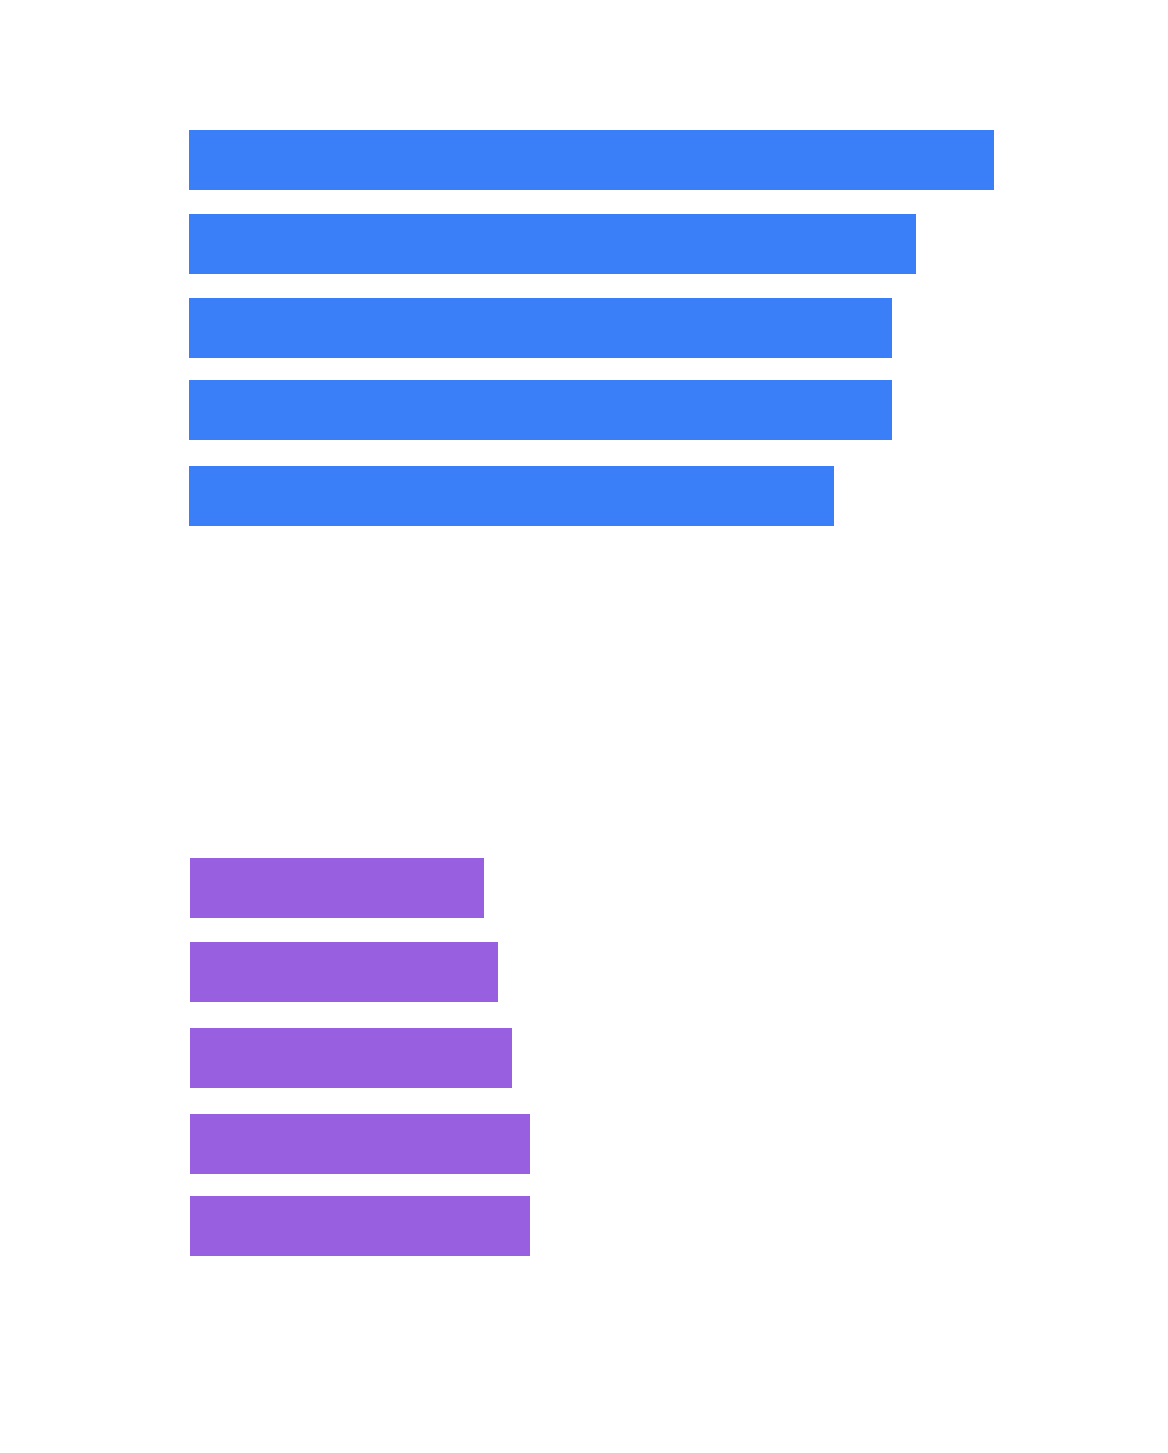
Classes With Highest Abandonment Rates
034 Smokers' Products
52%
032 Light Beverage Products
47%
005 Pharmaceutical Products
46%
033 Wines and Spirits (not including beers)
46%
025 Clothing and Apparel Products
42%
Classes With Lowest Abandonment Rates
011 Environmental Control Instrument
19%
008 Hand Tool Products
20%
021 Houseware and Glass Products
21%
007 Machinery Products
22%
020 Furniture Products
22%